Data analysis is key for businesses today. No single tool fits all organization’s needs. They’re unique. Understanding your data types and how you use data are vital.
First, you must gather data from different sources. Then, you save it in a data warehouse for easy access. Data security is a must, especially if many teams use the same data.
After setting up your data, you analyze it with various tools. Think about your business needs, who will use the tools, and your budget. It’s important to pick the right one.
Also Read: What Is The Role Of Big Data Technologies In Data Science?
Key Takeaways
- Data analysis is a crucial practice for modern businesses, but selecting the right tool is challenging.
- Understanding your data types and integration needs is the first step in choosing the appropriate data analytics tool.
- Ensuring data security and governance is crucial, especially when data is shared across departments.
- Evaluating factors like business needs, user profiles, data modeling, and pricing models is key to selecting the best data analytics tool.
- Leveraging a range of data analytics tools can provide a more comprehensive understanding of your organization’s data.
Introduction to Data Analytics Tools
Today’s world is all about data. Many data analytics tools are available to help organizations make sense of a huge amount of information. However, choosing the right tool is not easy. This is because different tools suit different organization’s needs. No one tool is perfect for everyone.
Also Read: What Are The Fundamental Skills And Tools Required For A Data Analyst?
Importance of Choosing the Right Data Analytics Tool
The choice of data analysis software is crucial for making good decisions. The right tool can make data work easier, offer better analysis, and make insights clearer. On the other hand, using the wrong tools can cause problems, isolate data, and lead to bad decisions.
Also Read: What Are The Benefits Of Taking Online College Courses?
Factors to Consider When Selecting a Data Analytics Tool
When picking data analytics tools, think about several important things:
- Understanding your data and integration requirements is key. Make sure the tool fits with the data you work with and can work with your current systems.
- Look into the tool’s data security and governance. Check if it’s safe, meets governance standards, and follows data laws.
- Think about who will use it, if it’s clear for both tech and non-tech people. It should be easy for anyone to use.
- See if it can handle complex data structures. Find out if it can do advanced data modeling tasks.
- Understand its pricing and any extra costs. Look into the tool’s fees and if you might need to pay more later.
Also Read: What Are The Most Popular Majors At The University Rhode Island?
By carefully thinking about these points, organizations can pick the data analysis software that fits them best. This will help them get the most out of their data.
Business Intelligence Tools

Business intelligence (BI) tools are key for data analytics these days. They help companies get important info from their data. These tools are great for business analysts. They let them look at, track, and report on important business numbers.
Also Read: What Programs Are Available at South University Virginia Beach?
Key Features and Benefits of BI Tools for Data Analytics
BI tools are very flexible and offer many features. These features help make analyzing data easier. Here are some important features:
- Self-service capabilities, allowing users to independently explore and analyze data without relying on IT support
- Predictive analytics functionalities, enabling organizations to forecast future trends and make data-driven decisions
- Advanced SQL modes, catering to users with varying levels of technical expertise
Using BI tools for data analysis has many benefits. They help companies understand what they do well, find chances to grow, and make smart choices.
Example: datapine
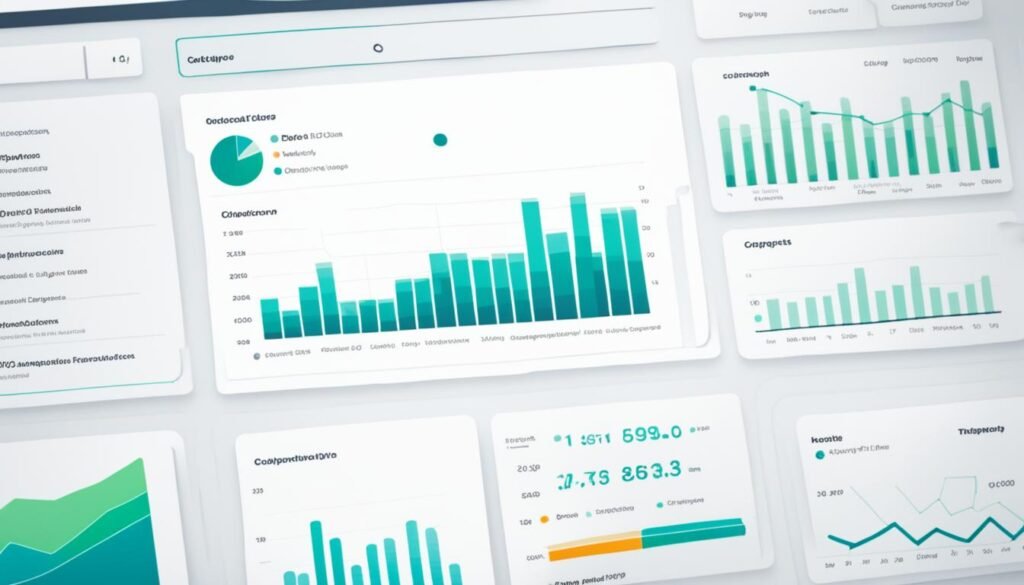
datapine stands out as a great BI platform for analytics. It’s user-friendly, with a drag-and-drop interface that makes analysis easier for everyone. Its strong predictive analytics, interactive dashboards, and automatic reports help companies find important insights. This lets them make choices based on solid data.
| Feature | Benefit |
|---|---|
| Visual Drag-and-Drop Interface | Streamlines the data analysis process, making it intuitive for users of all skill levels |
| Powerful Predictive Analytics | Helps organizations forecast future trends and make informed strategic decisions |
| Interactive Dashboards | Provides a comprehensive overview of key business metrics, enabling real-time monitoring and reporting |
| Automated Reporting | Generates customized reports, saving time and enhancing the efficiency of the data analysis workflow |
By using tools like datapine, companies can get more out of their data. They turn data into useful insights that help businesses grow and innovate.
Statistical Analysis and Programming Languages

In data analytics, using statistical analysis tools and programming languages is key. They help to find important insights in big data. These tools let data analysts work with data in many ways to find valuable insights.
Role of Programming Languages in Data Analytics
Python and R are now essential for data analysts. They offer many tools and libraries for data work. These programming languages for data analytics let analysts use advanced methods like statistical models and machine learning. They also help to show data in clear ways.
Example: Posit (Formerly RStudio)
Posit, previously RStudio, is a top pick for data analysis. It’s an IDE for data experts and researchers. Posit has over 10,000 tools, making it strong for almost any data task. It helps with everything from cleaning data to making complex models.
Posit is easy to use and has great visualization tools like ggplot and plotly. By using these statistical tools and programming languages, Posit supports smart, data-driven choices. It helps companies make the most of their data.
Qualitative Data Analysis Tools

Not all data in business and research is numbers. Non-numerical info is key too. That’s where qualitative data tools help. They let people study big piles of info from interviews, surveys, and feedback.
Importance of Qualitative Data Analysis
Qualitative data digs deeper than numbers. It helps find trends and issues that numbers miss. This method gives a full look at customers, operations, and choices.
Example: MAXQDA
MAXQDA is for big piles of text, audio, or video data. It turns speech into text automatically. You can highlight key parts with codes, colors, or emojis. Researchers and business people like it for making sense of lots of different kinds of information.
| Feature | Benefit |
|---|---|
| AI-powered transcription | Streamlines the process of converting audio recordings into text for analysis |
| Coding and annotation tools | Enables users to identify and categorize important themes and insights within qualitative data |
| Visualization and reporting | Provides intuitive data visualization and reporting capabilities to communicate findings effectively |
Tools like qualitative data analysis tools, such as MAXQDA, help see beyond the obvious. This leads to smarter decisions. They’re crucial for a competitive edge today.
Data Analytics

Data analytics is about looking at information to find useful insights. You use these insights to make smart decisions. The steps involved are preparing the data, exploring it, creating models, and showing the results in visual forms.
Overview of Data Analytics Processes
The data analytics process starts with collecting data. Next, you clean and prepare it for analysis. Then, you look closely for patterns and trends that can help you understand the data better. You can use various techniques to predict future outcomes based on the data.
Common Tools Used in Data Analytics
There are many tools for data analytics. Some of them are:
- Spreadsheet software (e.g., Microsoft Excel) helps with organizing and analyzing data.
- Programming languages (e.g., Python, R) are for advanced analysis and modeling.
- Business intelligence (BI) platforms make data easier to understand with visuals.
- Database management systems (e.g., MySQL, PostgreSQL) are for handling big sets of data.
- Data mining and machine learning tools are for finding patterns and making predictions.
With these tools and skilled analysts, companies can turn their data into insights. This helps in making better decisions backed by data.
Microsoft Excel
Microsoft Excel is widely used for data analysis. It’s a great tool for managing and extracting insights from lots of data. Professionals and analysts use it to handle large datasets.
Excel’s Capabilities for Data Analysis
Microsoft Excel goes beyond basic spreadsheets. It has many tools for data analysis.
These tools include:
- Spreadsheet functions for managing and organizing data, such as sorting, filtering, and automating calculations using formulas like “AutoSum”.
- Powerful graphing and charting tools that allow users to visualize data in a variety of formats, from line charts and scatter plots to pivot tables and dashboards.
- The Analysis ToolPak, providing advanced statistical analysis tools. This includes regression analysis, variance analysis, and more.
Excel also helps clean, transform, and manipulate data. It is great for the whole data analysis process. Many industries use Excel for data-driven decisions. Its simple design and wide use make it a top tool.
| Feature | Benefit |
|---|---|
| Spreadsheet functions | Organize and manage data effectively |
| Graphing and charting tools | Visualize data in informative and engaging ways |
| Analysis ToolPak | Perform advanced statistical analysis |
“Excel’s simplicity and versatility make it a powerful data analysis tool suitable for managing, sorting, filtering, cleaning, analyzing, and visualizing data.”
Python
Python is a versatile and powerful programming language. It has found a strong place in data analytics. With its easy-to-understand syntax and a wide range of libraries, Python is a top choice. It helps data experts streamline their work.
Python Libraries for Data Analytics
Python’s biggest strength comes from its vast library collection for data analytics. These libraries can do everything from simple number crunching to advanced statistical work. Among the most popular libraries are:
- NumPy: This library is great for working with numbers. It supports big arrays and comes with many math functions.
- Pandas: It focuses on making data easy to work with. It’s used for all sorts of data, whether it’s tables or time-based.
- Matplotlib: For making all kinds of graphs, this library is essential. It makes your data come to life visually.
- Scikit-learn: A go-to for machine learning tasks. It offers many tools for analyzing data in-depth.
- SciPy: Primarily for scientific computing, it includes tools for stats, math, and more. It makes complex calculations easy.
These examples show how Python gives data experts a powerful toolkit. With these libraries, they can get more from their data.
| Python Library | Key Functionality |
|---|---|
| NumPy | Numerical computing, multi-dimensional arrays, and mathematical functions |
| Pandas | Data manipulation and analysis, tabular and time series data |
| Matplotlib | Data visualization, creation of static, animated, and interactive plots |
| Scikit-learn | Machine learning, classification, regression, and clustering algorithms |
| SciPy | Scientific and technical computing, numerical integration, optimization, and statistics |
By using Python’s robust tools, data experts can make their work more efficient. They can find important insights in their data. This leads to smarter decisions in their companies.
“The beauty of Python is its simplicity. It has a very straightforward syntax, making it easy to learn and use for both beginners and experienced programmers alike.”
R Programming Language

In the world of data analytics, R is a top tool. It’s open-source and used for stats and data graphs. R is known for being easy to learn, which is great for both analysts and researchers.
R shines in statistical analysis. It’s excellent for complex math, testing ideas, and creating models. It also has many tools for making detailed charts and graphs.
R and Python are key languages for data analytics. R stands out with its deep stats and visualization options. It’s a must-use for those digging into big and tricky datasets.
Key Features of R Programming Language
- Open-source and free to use, with a large and active community of developers and users
- Powerful statistical analysis and modeling capabilities
- Extensive library of packages and functions for data manipulation, visualization, and machine learning
- Ability to handle a wide range of data types, including structured, unstructured, and time-series data
- Highly customizable and flexible, allowing users to tailor the language to their specific needs
“R is the language of choice for anyone doing serious data analysis.”
Whether you’re new or have a lot of experience, R is great to know. It has strong statistical tools and nice ways to show data. Plus, there are many users you can learn from in the community.
Data Visualization Tools

Data visualization is key in the data analytics world. It changes complicated data into easy-to-understand visuals. This lets analysts and decision-makers find important insights. Tableau is a top choice in this field, used by many businesses and organizations.
Importance of Data Visualization in Data Analytics
Data visualization is vital in data analytics for many reasons. It lets experts quickly spot patterns in big data sets. This makes it easier to understand the information. Tools for visualization also help in sharing findings with others. They make the data story more engaging.
By turning data into charts and graphs, it makes insights clear and useful. This adds power to data analytics, ensuring that findings lead to action.
Example: Tableau
Tableau is loved in the data analytics field for good reasons. It’s easy for both techies and non-techies to use. This means anyone can dive into data with Tableau’s help.
It shines with things like interactive dashboards and dynamic maps. These features are great for exploring and analyzing heaps of data. Whether you’re in business, marketing, or science, Tableau is a must-have.
“Tableau has changed how we look at data. Its easy-to-use features and strong visuals have improved how we share insights.”
– Jane Doe, Business Analyst
Database Management Systems

Database management systems (DBMS) are vital in data analytics. They offer a secure and structured storage for application data. This makes DBMS the foundation for many data-driven apps, letting professionals handle large amounts of data easily.
Role of Databases in Data Analytics
Databases are key in the world of data analytics. They’re the base for storing, getting, and managing data. Databases hold various data types, including structured and unstructured data. With DBMS, data analysts can work with data efficiently. They can find insights that help in making smart decisions.
Example: MySQL
MySQL is a top choice for many in data analytics. It’s an open-source relational database management system (RDBMS). Its strong features and ability to grow meet the needs of data pros, especially those working on the web. MySQL helps store data safely and analyze it with SQL.
Despite not being perfect, MySQL works well with many data systems. This makes it a good fit for lots of businesses. It’s loved for being easy to use, having lots of help resources, and community support.
| Feature | Description |
|---|---|
| Open-Source | MySQL is open-source, which means it’s easy to customize and has community help. |
| SQL Support | MySQL has strong SQL for working with data easily. |
| Scalability | It can handle big data and high-traffic apps, perfect for data-heavy projects. |
| Cross-Platform | Works with many operating systems, making it flexible for data analysts. |
In the end, tools like MySQL are crucial in the data analytics field. They offer a safe way to handle and make sense of data. This allows data pros to make good decisions based on insights.
Business Analytics Platforms

In our data-driven world, business analytics platforms are vital. They help organizations find valuable insights and grow strategically. These tools blend several analytical functions, allowing users to access, report, analyze, and display data precisely.
Features of Business Analytics Platforms
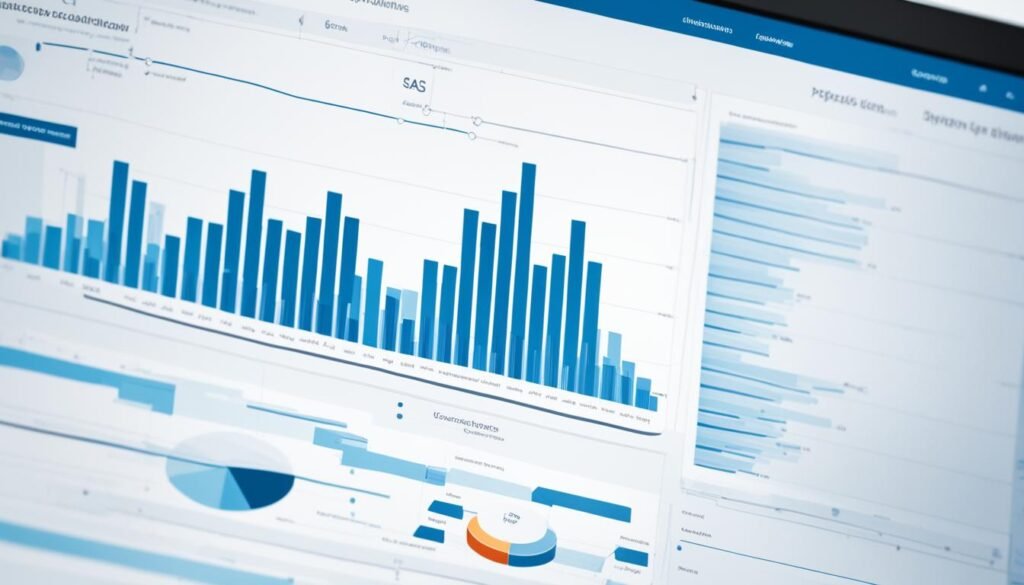
Top platforms like SAS offer features for today’s businesses. They give tools for stats, showing data clearly, predicting future trends, and working with various data sources. Plus, they have teamwork features for group projects.
- Robust statistical analysis tools to uncover complex patterns and relationships within data
- Intuitive data visualization capabilities to present insights in a clear and compelling manner
- Predictive modeling functionalities to forecast future trends and scenarios
- Seamless integration with a variety of data sources, including databases, spreadsheets, and real-time feeds
- Collaborative features that enable cross-functional teams to work together on data-driven projects
Example: SAS Data Analytics
SAS is a top choice for many, offering a powerful statistical analysis suite. With its simple yet strong interface, it’s ideal for making data-informed decisions. Many organizations prefer it for its ability to handle complex analyses with ease.
With SAS, users can manage data, report, perform advanced analytics, and forecast future trends. Its vast library of statistical methods allows for accurate predictions. This empowers analysts to find hidden patterns and create strategies for growth.
Using tools like SAS helps firms make better decisions and stand out in their markets. It allows them to fully utilize their data, gaining a competitive advantage.
Also Read: Beyond Basics: Advancing With Diploma Courses
Conclusion
Today, the world of business relies heavily on data. Being able to use and understand this information is key. We’ve explored many tools and software for data analytics, showing there are many ways to succeed. These include business intelligence platforms, programming languages for stats, and tools for visualizing data.
Knowing the features and benefits of these tools helps businesses choose what’s best for them. For example, some might want to use BI dashboards for deeper insights. Others might prefer Python or R for complex stats. And some may use Tableau for creating engaging data visuals. The choice of tools can make a big difference in how effective data analysis is.
Data analytics is always changing. To stay ahead, organizations need to follow the latest trends and technologies. By making the most of data analytics, companies can open new doors, improve their decisions, and find success in the competitive business world. This is all about understanding the power of data and using it wisely.
FAQs
What are the common tools and software used in data analytics?
Common tools in data analytics are many. There are business intelligence platforms, statistical analysis and languages, tools for qualitative data, and data visualization software. Database management systems and business analytics platforms are also key.
Why is it important to choose the right data analytics tool?
It’s vital to pick the right tool because each organization’s needs are different. You should think about your data, security, and user needs. Also, consider a tool’s data modeling and its pricing and licensing.
What are the key features and benefits of business intelligence (BI) tools for data analytics?
BI tools offer business analysis features. They have self-service options, predictive analytics, and advanced SQL. For example, datapine BI provides a drag-and-drop interface, strong predictive analytics, and interactive dashboards.
What is the role of programming languages like Python and R in data analytics?
Python and R are essential for data analysts. They use these languages to explore and understand data. Posit (RStudio) is a top tool for data work, supporting over 10,000 packages for various tasks.
Why are qualitative data analysis tools important?
Tools for looking at non-number data are key. They help analyze large data sets from interviews, surveys, and feedback. MAXQDA is one top choice, making it easier to organize and find important data points.
What is the role of databases in data analytics?
Databases are vital. They provide a safe place to keep data. MySQL, for example, is widely used. It secures and offers data analysis through SQL.
What are the key features of business analytics platforms?
These platforms help with decision-making using different tools. For instance, SAS allows users to analyze, report, and visualize data. It supports complex stats, makes visualizations, and has predictive tools.


